Is your glass half full or half empty? The fun thing about shipping market analysis is that you can show almost any chart or data point and come up with a convincing argument for why it can be interpreted both bullish and bearish. There is always two sides to the story – which is, of course, what makes a market.
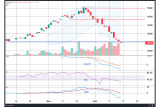
Take the graph of Capesize congestion in China (100k DWT+) shown below. Two things are immediately apparent. One is the elevated COVID-related congestion during late 2021 and early 2022 – a major contributor to the strong market at the time. The other is the observation that current congestion is – by recent historical measures – extremely low.
The bearish take is that this is happening against a backdrop of record-high coal and iron ore imports, which suggests that the improvement in Chinese port efficiency is structural. Several years of modest trade growth has enabled the infrastructure to finally catch up, and so heavy port congestion in China – save for the odd short-term weather-related incident – will not return to support the market for the foreseeable future.
The bullish take is that the supply chain is now operating at such a high degree of efficiency that there is only room for disruption and a reduction in the effective supply of transport from here. Certainly, there is no downside in Chinese congestion. All it would take is a further increase in imports as the Chinese economy re-accelerates into 2024.
Which side you land on is probably a function of your initial market view or, simply, whether you got out of bed on the right foot. A deeper analysis of port capacity vs. throughput would get you closer to the right answer.
Dr. Roar Adland
Global Head of Research

Articles
You may also be
interested in
View allGet in touch
Contact us today to find out how our expert team can support your business


